Image: RACQ
We’re hearing solar retailers are in a world of pain. But the market is setting records. What can explain that contradiction?
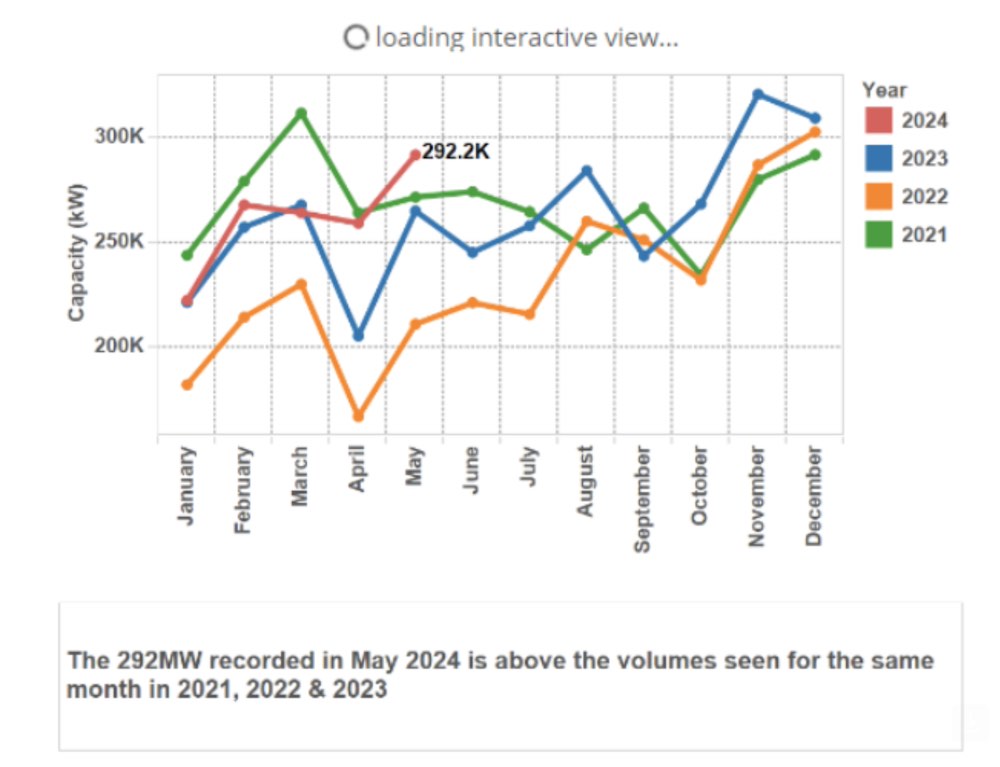
As recently reported, May’s volumes (292MW) set a record level for any May, and were the fourth largest month on record for the STC market. 2024 is 7% ahead of 2023, in MW terms.
One factor for retailer complaint is customer numbers were materially down on 2023, at least for the first three months of the year. Many businesses experience ‘busyness’ in terms of how many installations they do. This goes some way to explaining the difference between record kW and retailers’ complaints.
It is true that commercial PV is having a record start to the year. Compared with STC commercial which is 14% up on last year, residential is “only” 6% up in volume. Six per cent growth isn’t exactly the doldrums.
The data shows the opposite. The amount of 2024’s YTD volume that came from 2023 installations is the same as in the prior year. The upside (growth) has all come from installations that took place in 2024. 2024 is one of the ‘freshest’ years to date when it comes to installation lag.
So it’s not 2023 installations skewing 2024 data. But STC registration date smooths out installation date – perhaps there’s something in that? We do publish kW by installation date.
Unfortunately it takes a few months to “true up” to near its final value (as all the STCs from earlier month’s installations are progressively accounted for).
We correct for this by applying a “monthly true up factor” – though the accuracy is limited for the most recent month or two.
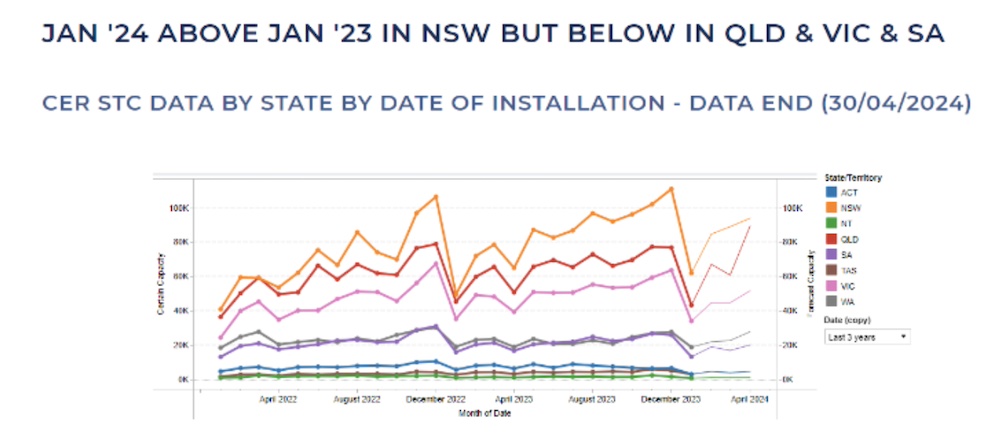
Still, this chart shows January 2024 was significantly worse in Queensland and South Australia than January 2023. Countering that, it appears January 2024 was far better in New South Wales than January 2023. Further, Queensland appears to have shot out of the starting blocks.
No, this doesn’t explain the doldrums.
Well, NSW is off to a record start for the year. Queensland is only just behind its record year-to-date (2021), but the same can’t be said in Victoria.
What’s evident is that NSW is 16% up on 2023 YTD and Queensland is 9% up. The best Victoria and the smaller states can manage is 4% annual (YTD) growth in kW.
And it’s not one particular company hogging all the customers, either. This chart shows the market share of companies based on their MW registered in 2023. The market share of companies (excluding aggregators) doing >10MW is a bit less than it was in 2023. The market share of companies that did <2MW in 2023 is the fastest growing cohort.
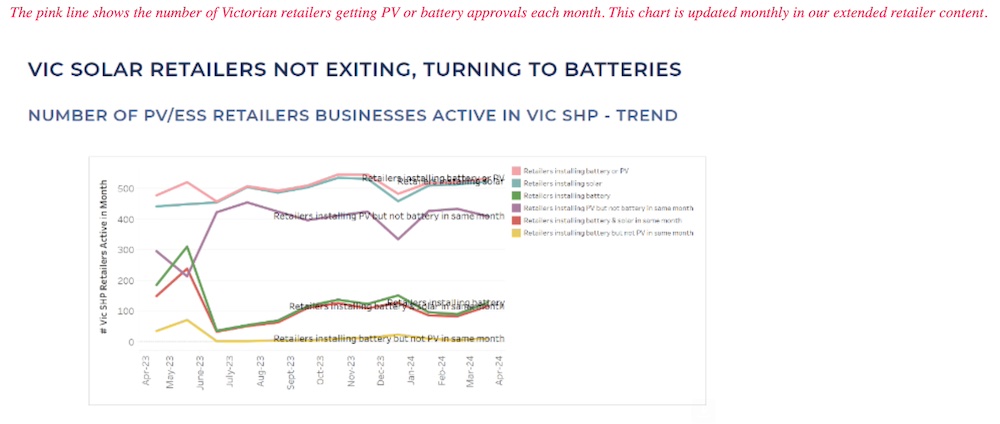
Nor is it that there are more companies, spreading all that kW around. Solar Victoria data shows there are about the same number of companies currently operating as there has been over the past year.
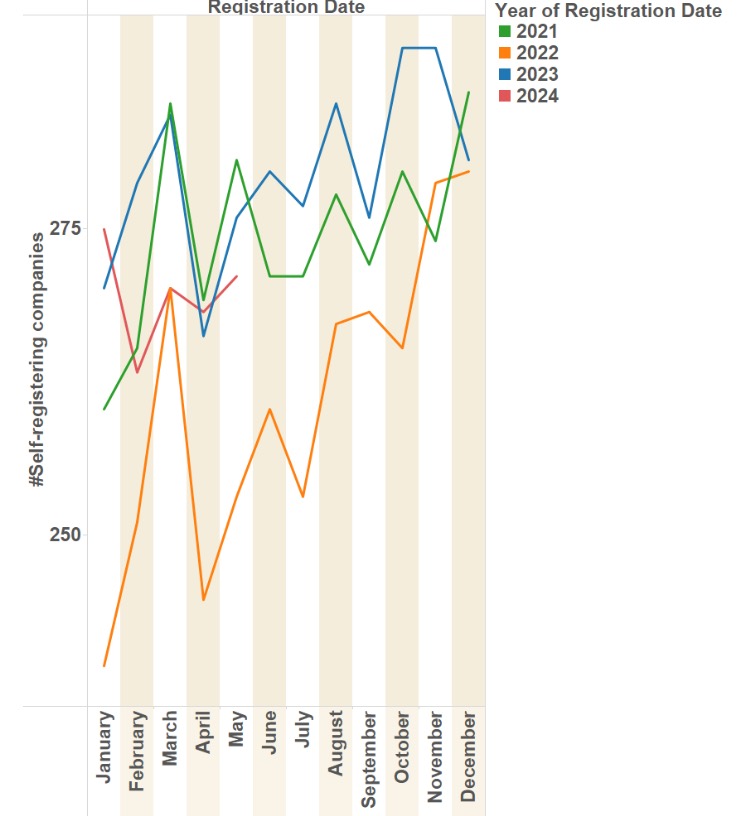
And by other accounts there are slightly fewer companies (self-registering STCs) in 2024 than in previous years. More capacity overall, combined with fewer companies, means each company is doing more capacity on average.
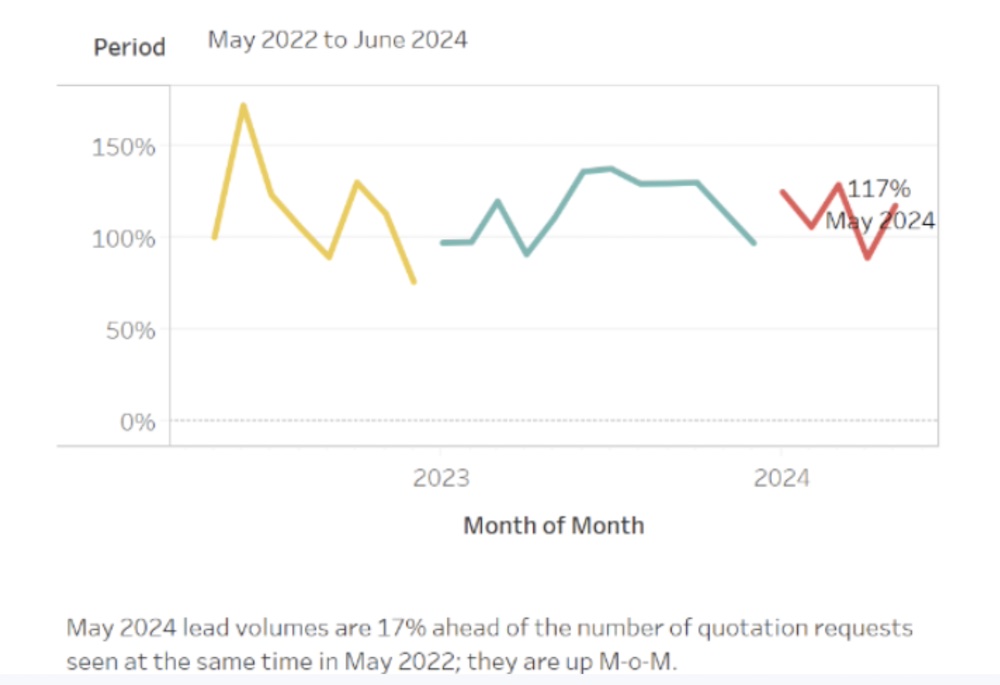
There is certainly merit in this argument. Lead volumes in May 2024 were 17% ahead ahead of May 2022. However, this was a lower level of lead volume than was sustained in H2-2023.
And the number of proposals per organisation (light blue) was down 12% in April 2024 compared to April 2023.
Sales per organisation (red) were also down, not to the same extent, but on course to stay at depressed levels.
The proposal-to-sale conversion rate is also falling, and also taking longer. Lower volumes of leads and customers are factors that do explain retailer’s complaints about slow business. These are very likely coupled to the broader malaise facing the Australian economy.
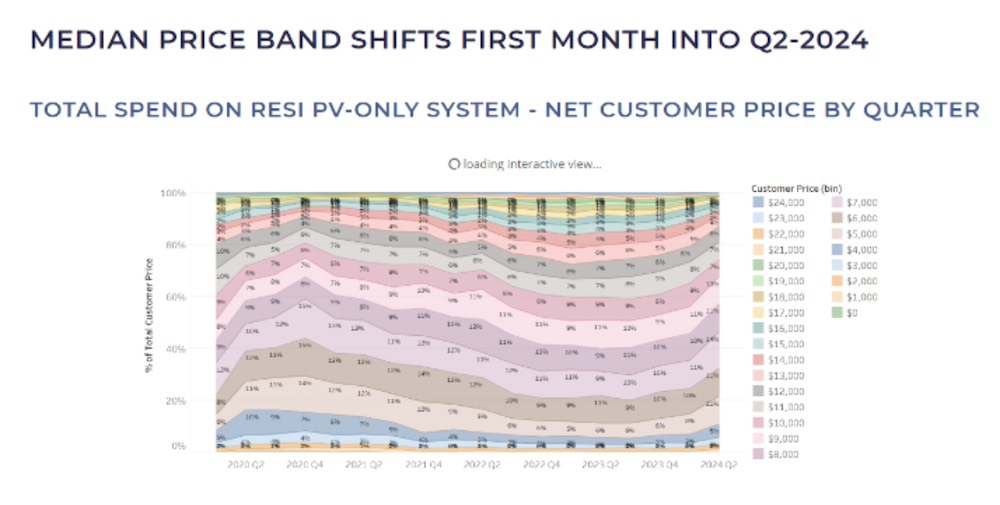
We are seeing a significant shift in the amount spent by customers. For a long while the median purchase price (net after subsidy) was in the $9000-$9999 range.
In recent quarters that was slowly trending towards the $8k band, but in Q2-2024 there’s been a rapid reduction in typical customer spend.
Part of the reason is lower retail $/W being charged. Adding to that is the tendency to use lower-priced product.
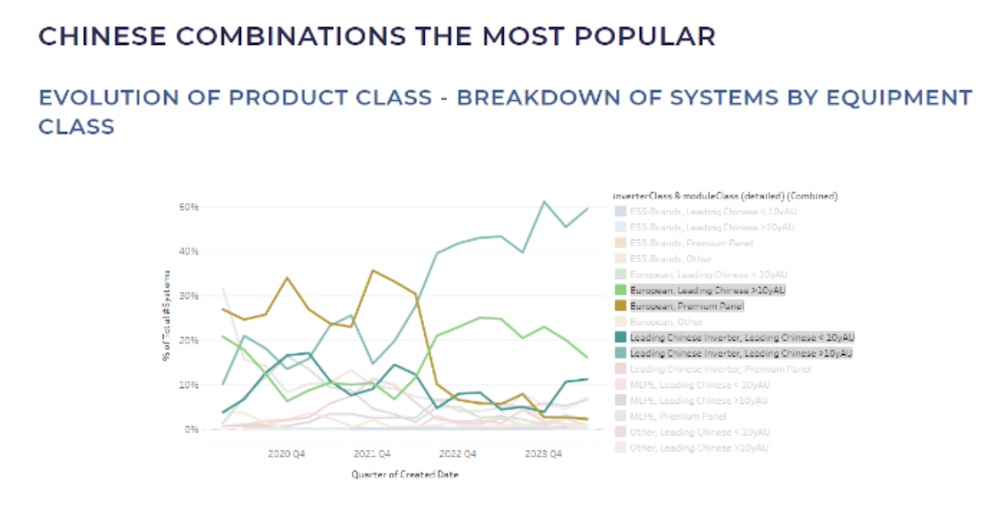
This chart reveals the demise of the pure-premium product combination (brown), which was replaced in 2022 by a combination of Chinese panels with European inverter (light green) and Chinese panels with Chinese Inverter (light blue). However, premium inverters have been losing market share in 2023 and 2024.
For some time the growth in system size and the growth in the overall market was sufficient to sustain retailer revenues, even as per-unit prices fell and higher-priced equipment lost market share.
However, the current economic climate combined with retailer desperation to make a sale means the next frontier of low prices is smaller systems. The chart below depicts the turnaround in the downwards trend in volume of 4-6kW systems.
To summarise, we have soft consumer interest, with a lengthening buying cycle and reducing sales conversion rate. This combines with consumers paying less when they do proceed.
This means retailers revenues are hard hit – it’s no wonder retailers are complaining. While kW installed is at very healthy levels, the 7% growth in YTD volume isn’t enough to offset the declining prices of panels and systems.
Soft consumer interest evidently does point to declining growth in the second half of the year, but these aren’t the only factors influencing the solar industry, which traditionally finishes the year strongly.
Warwick Johnston is managing director of SunWiz
This post was published on June 20, 2024 6:30 pm
Three simple, effective ways to stop your solar electricity going to waste.
Clean Energy Regulator issues fresh reminder to follow the rules governing the rooftop solar industry…
China giant unveils new inverter series in Australia and New Zealand, high-voltage hybrid inverter for…
A project in Melbourne that provided free energy audits and energy upgrades for private rental…
New study finds new-build homes more than twice as energy efficient as homes built in…
Alastair Matcott worked on a project that provided free energy audits and free renewable energy…