Image: Andrew Wilson
It’s now been four years since our home solar and battery system was commissioned at the start of August 2019, and I’m pleased to be able to continue sharing a data driven, objective look at how the system has performed technically and financially to date.
A snapshot of the system specifications:
Tesla Powerwall 2 battery – 5 kW / 13.5 kWh
20x SunPower P19 315 W modules – 6.3 kWp
20x SolarEdge P320 power optimisers
SolarEdge HD-Wave single-phase inverter – 5 kWac
SolarEdge Immersion Hot Water Heater Controller – 3.6 kWac
More information about the system itself as well as an analysis of Year 1 is available here. An analysis of performance in Year 2 is available here. Note that there was no analysis published for Year 3, but data from this period is included in the below analysis where relevant.
In the spirit of transparency I’m also making the raw data for all four years available to download here for anyone interested.
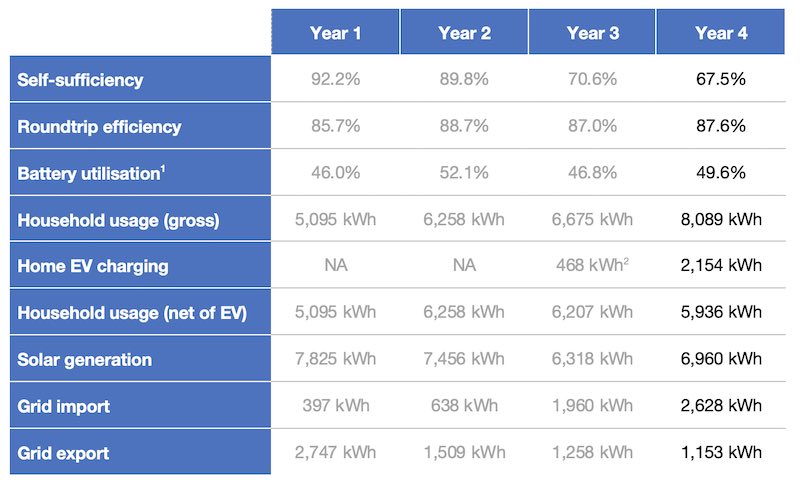
Household self-sufficiency for Year 4 came in at 67.5%. This was a big drop from Year 1 and Year 2 which achieved 92.2% and 89.1% respectively, but closer to Year 3 at 70.6%. The driver of this step-change in recent years is a combination of supply and demand side factors discussed further below – the most notable being the addition of an EV to the garage from the end of Year 3 onwards.
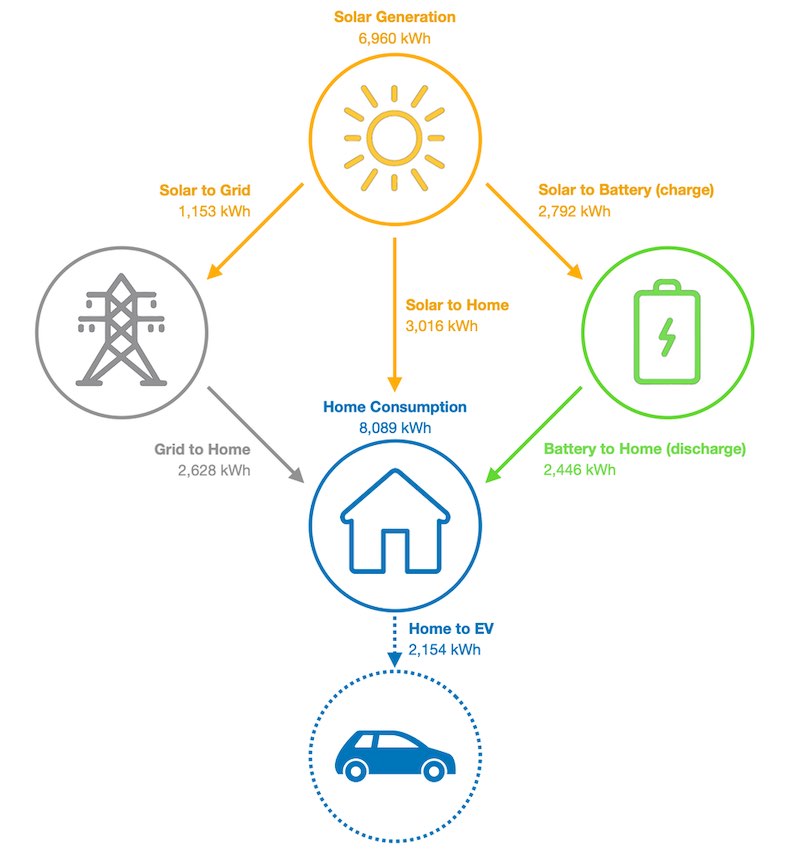
The key figures for the system over its life to date are summarised in Table 1 below, and the power flows during Year 4 are illustrated in Figure 1.
1) Daily discharge kWh as a % of nameplate (13.5 kWh) (excl. degradation)
2) EV only present for final two months of Year 3
Year 3 saw the first reliability niggles in the performance of the solar system. First a faulty inverter took the whole system offline for 18 days in January 2022 before being replaced. This was followed almost immediately by a single DC optimiser becoming faulty and taking its associated panel offline until replacement parts could be sourced and the repair undertaken in mid-July 2022 – an impact to 5% of system capacity for around 6 months.
These issues contributed to solar production in Year 3 being 19% lower than Year 1 and 15% lower than Year 2. It’s noteworthy that Year 3 (2021/22) also coincided with prolonged La Nina conditions (and associated reduced irradiance) across Eastern Australia, including the 2022 Brisbane Floods. Although production has picked back during an uneventful Year 4, it was still 5-10% down on Years 2 and 1 respectively.
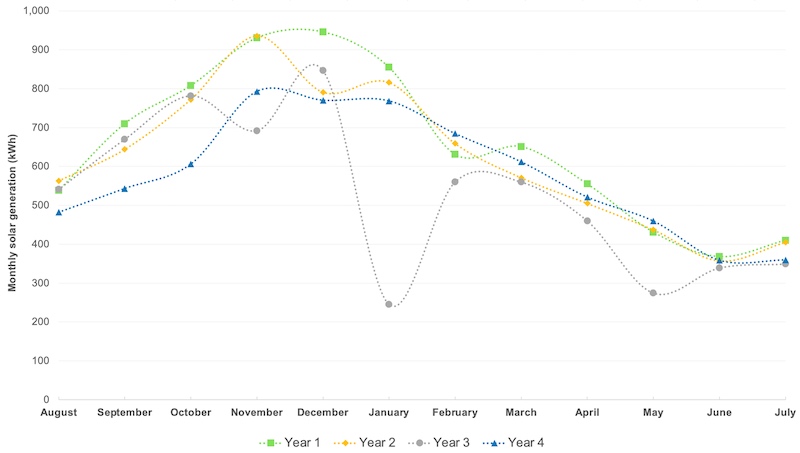
Figure 2 compares monthly solar production across the four years, with the inverter outage in January of Year 3 having an obvious impact. What’s also interesting about this graph is to see the relative consistency of generation outside of Summer – on par with that you’d expect for a sub-tropical city like Brisbane.
Self-sufficiency continues to suffer from not enough solar generation outside of summer months (see Figure 3) – a fact only exacerbated by the introduction of an EV to the demand side of the equation (more on this below). The moving of several panels that suffer from winter shading plus the addition of extra panels to max out the inverter’s DC limit is a job that remains on the to-do list.
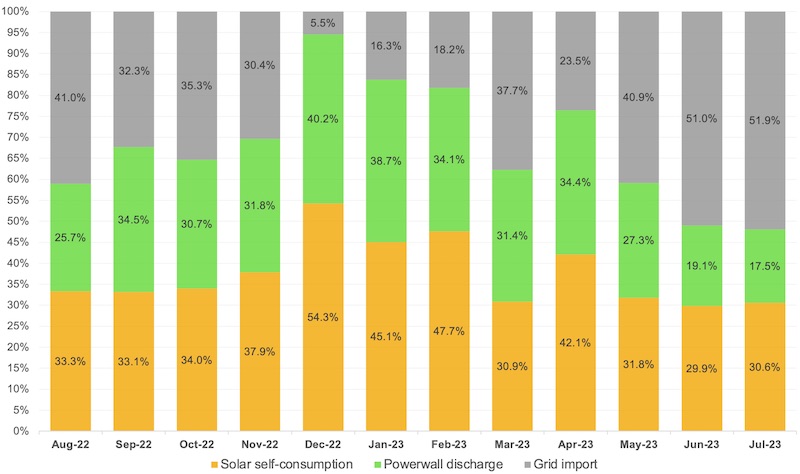
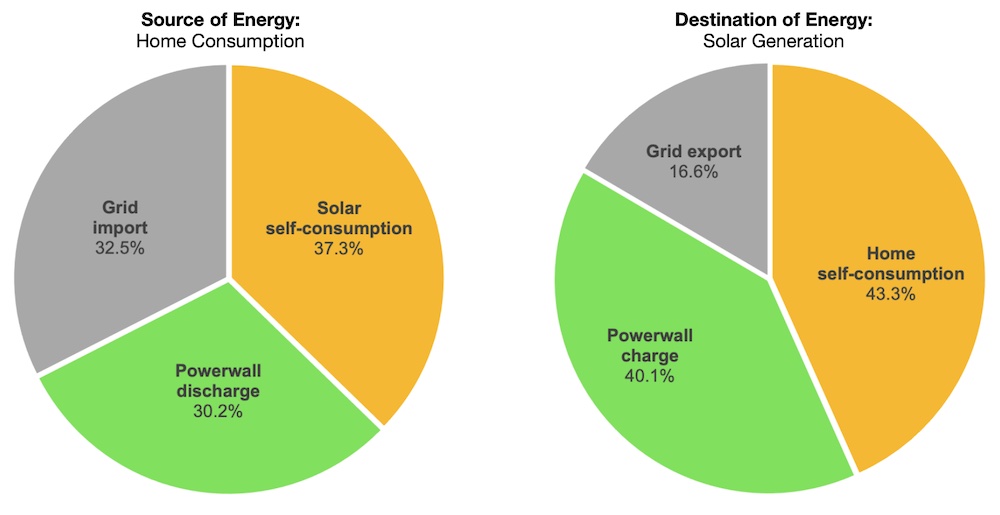
Energy flows across the year can also be assessed by comparing the source of demand and the destination of generation side by side (Figure 4).
It’s interesting to take a moment here to talk about grid exports. These have fallen from 35% of generation in Year 1, to 20% in Year 2 and Year 3, to a little under 17% in Year 4.
Whilst these figures probably give great delight to my retailer versus the typical homeowner with PV, it is frustrating that they remain stubborn despite a large new load in the form of an EV.
Whilst there has been some some progress on aligning EV charging with sunlight hours (see more below), the reality remains that the car is only parked at home sucking up summer electrons two to three days a week at most.
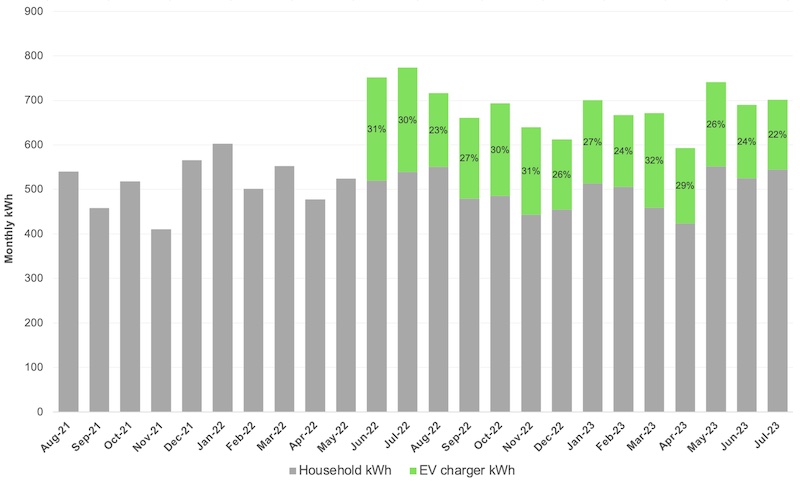
Household consumption saw a sharp spike upwards in Year 4 (+22% from Year 3) as a result of regular home EV charging. Indeed, over 90% of all charging in the past 12 months was undertaken at home.
Figure 5 illustrates the impact of this on gross household consumption, splitting out EV charging from underlying household demand. This shows that nearly 27% of gross household consumption was due to EV charging, which means that on a net consumption basis, Year 4 was actually 4-5% lower than Year 2 and Year 3 consumption levels.
Despite best efforts to feed this new consumption with solar generation, the reality is that this is a difficult task through large parts of the year.
The result is that grid imports hit an all-time high in Year 4 – up 34% from the prior year and a staggering 560% since Year 1’s high water mark for self-sufficiency. The good news is that the majority of this import occurred during the super-off-peak window offered by Powershop to EV owners at a rate of just 8c/kWh.
Another topic to touch on briefly is the technical performance of the BESS. Round trip efficiency (RTE) came in at 87.6% during Year 4. RTE has now averaged 87.2% since installation. This is slightly below the datasheet expectation of ~90% but given the limitations of my calculations and the dynamics of real-world usage versus standard test conditions, it’s probably fair to say this is meeting expectations.
The battery provided just over six hours of off-grid supply in early January 2023 during a planned outage while Energex replaced power poles on the street. It performed flawlessly during this time while I worked from home – charging from solar while keeping reliable supply to the house without so much as needing to reset the oven clock during the changeovers.
One aspect that was interesting to observe during this event was the shutdown of the solar system once the battery had reached full charge – with the grid out of action there was nowhere else for the surplus energy to go. It also restarted again flawlessly once there was sufficient headroom back in the battery to add more charge.
I was particularly impressed by this given that the battery (Tesla) and the inverter (SolarEdge) have no direct communication or control with one another.
The start of June 2022 saw a Hyundai Ioniq 5 Long Range AWD electric vehicle join the household (see Figure 5). This has brought with it a range of new insights on charging options, efficiency, and running cost.
Key statistics from the first year of driving are summarised below:
Distance travelled: ~14,000 km
Efficiency: 162 Wh/km*
Charging energy: 2,384 kWh**
Charging cost: $239**
BAU fuel cost: $2,394***
Fuel cost savings: $2,155***
* Based on information provided by the car’s trip computer and does not necessarily align to metered kWh values due to efficiency losses during charging
** Includes home charging + paid public charging only (excludes small number of unmetered free public charging sessions during the year)
*** Compared to previous car (Subaru XV) consuming 9.0L per 100km at $1.90/L
The real standout for me was the efficiency achieved – coming in at 162 Wh per km. This is 15% below the official WLTP figure of 191 Wh per km and a pleasant surprise to see a strong overperformance on this metric – a stark contrast to a certain other EV manufacturer!
In a year of high fuel prices, it was also interesting to do the maths on the fuel cost savings – coming in at $2,150 cheaper than if the same distance had been travelled in the previous petrol SUV. This was achieved in part by the great value EV charging tariff offered by Powershop (8c per kWh) and limited use of high cost public fast chargers.
These savings alone were never going to be enough to justify the cost of upgrading to the Ioniq 5, but they’re also not like-for-like vehicles, and these figures do show we are getting tantalisingly close to cost of ownership parity for lower priced EV models and/or higher annual kilometre drivers.
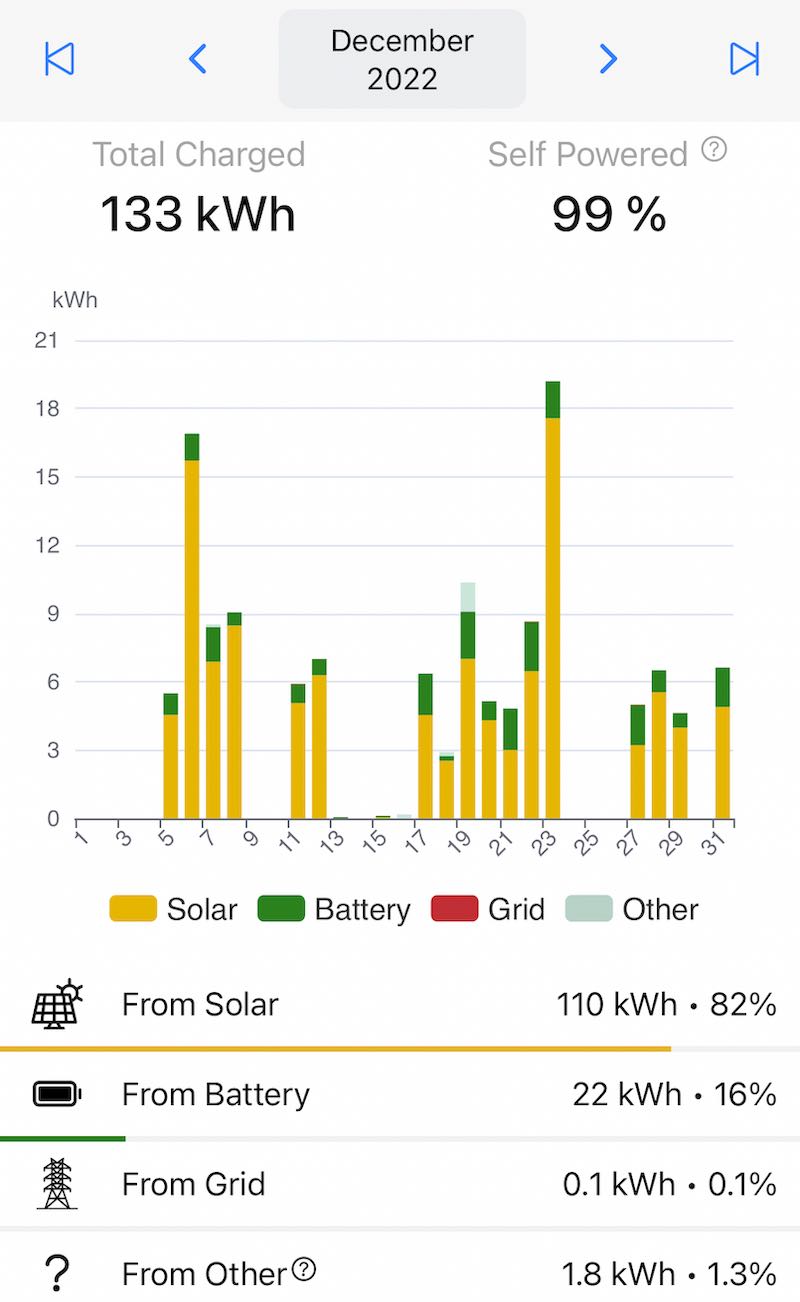
Throughout the first year about 95% of EV charging was done at home. Wherever possible this was done using surplus solar PV that would otherwise have been exported to the grid once the battery was full.
This was enabled through the brilliant ChargeHQ app. This software-only solution is a genuine game changer – making smart home charging capability accessible to as many people as possible through both car-side and charger-side control options.
Assuming you have a compatible smart inverter, the app enables real time adjustment of EV charging demand to balance load flows and soak up PV that would otherwise be exported. It’s not perfect (due to inherent lags in data refresh rates, especially during cloudy conditions) but it’s pretty damn good.
Figure 7 shows the results during December, where with a little buffering from the battery, 99% of home EV charging was self-powered.
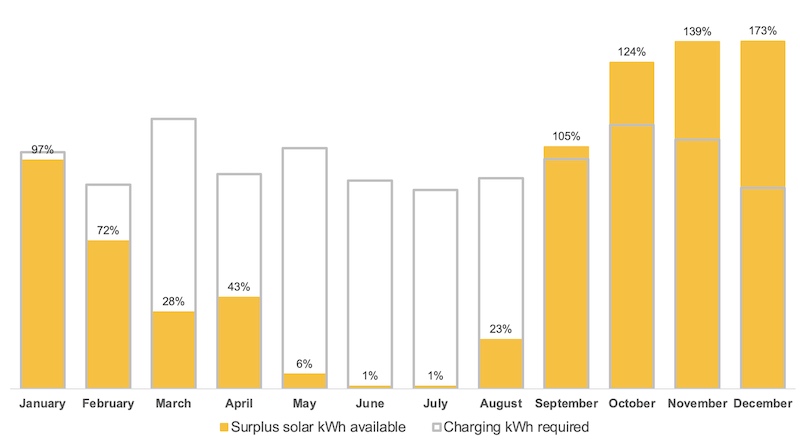
This leads us to the biggest challenge faced by the system – the large disparity in available generation across the year. Whilst December provides a great example of the ability to achieve high self-sufficiency, the middle of June or July are a starkly different story.
Figure 8 below was first put together as an estimate in anticipation of purchasing an EV and has since been updated to reflect actual charging demand for the first year.
Across the year ~70% of EV charging could in theory be met by surplus PV generation, but in reality this plays out as an overabundance in late Spring / early Summer and a giant deficit in winter.
Even with plans to tweak and expand the PV system it’s going to be very difficult to overcome this seasonality issue. This is compounded by the fact that EV is only parked at home able to align charging with surplus solar hours two to three days per week.
Interest in the economics of home batteries is surging with rising power prices and a more aggressive sales push from installers. Four years of operations from my home system provides one perspective on this, but nonetheless an objective and real-world example of how things stack up.
Before getting into the specific figures, it’s worth pausing for a moment to reflect on the backdrop of electricity tariffs. These have jumped sharply since the system was installed, and even more sharply again from 1 July this year.
The two most interesting metrics for a current or prospective home battery owner are the daily supply charge and tariff spread.
Short of going off-grid (see above for why this is a very bad idea!) there is no getting out of paying the daily supply charge. For the first three years, this ranged between $1.10 and $1.12 per day with my retailer (Powershop). In Year 4 this shot up to almost $1.29 per day, and from 1 July 2023 it has jumped again to almost $1.46 per day (+31% since Year 1).
While it’s understandable that the structural changes happening to electricity consumption are causing this, it does inevitably erode the benefits of moving to solar and/or BESS (insert conspiracy theories here!).
In my view this is now the number one item that it is worth shopping around for in a retail plan as a solar + BESS owner with high levels of self-sufficiency.
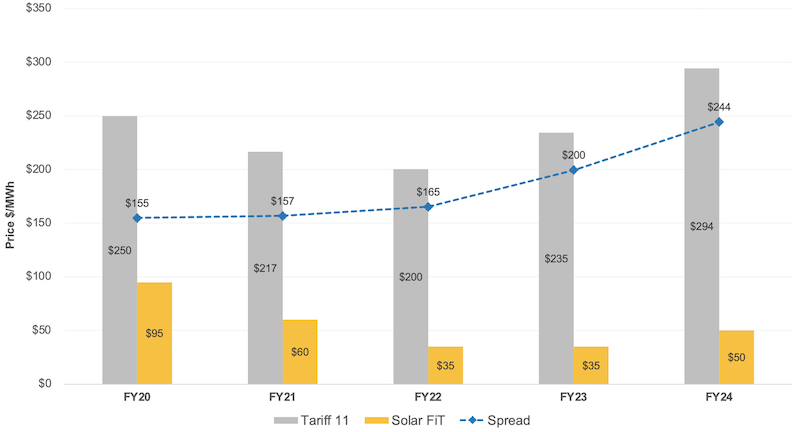
The second metric of interest is the spread between the tariff for consumption versus the feed in tariff for solar exports. The larger this spread, the more lucrative it is to avoid exporting PV and instead store it for later to offset consumption.
As seen in Figure 9 (using Powershop’s Queensland Tariff 11 as an example) this spread has grown strongly over the past five years and is now sitting at almost $250/MWh.
It’s important to note that, in practice, BESS (and especially EV) owners are likely to see more benefit from a time-of-use (ToU) tariff rather than a flat rate like Tariff 11. Indeed, this has been the case at our household since June last year (note that for simplicity though, all analysis in this article assumes a Tariff 11 flat rate structure).
This change to a ToU structure enabled access to the Powershop EV super-off-peak rate of 8c per kWh. The presence of the battery meant that the potential pain of ~40c per kWh peak rates associated with this plan could be largely avoided.
The value the BESS offers in this respect is worth pausing on. Without it, we would have had to either remain paying 23.5c per kWh for EV charging, or deal with paying extremely high rates during the evening peak.
To roughly quantify this benefit, accessing the EV super-off-peak tariff meant home charging was $350 cheaper than it would have been under Tariff 11.
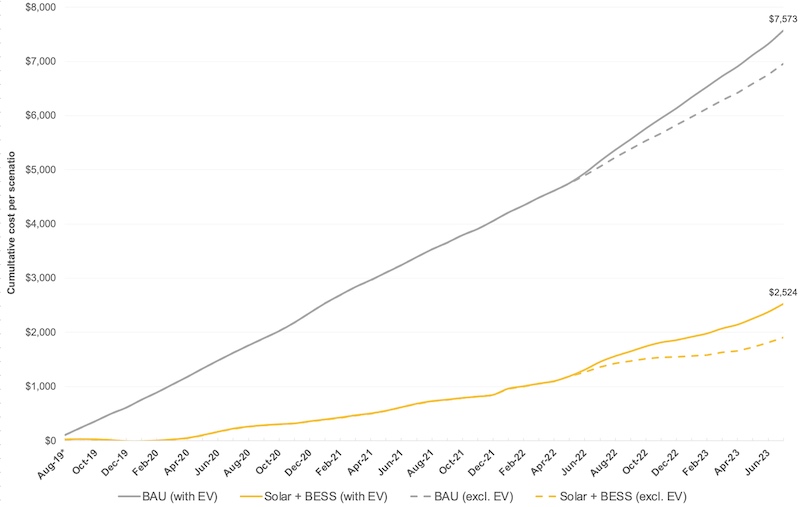
In Year 4, the solar + BESS delivered a total saving of $1,321 or 56% compared to BAU. This has been partly influenced by the addition of the EV which saw household consumption jump sharply, and as such Figure 10 now shows the cumulative cost for the BAU vs. solar + BESS scenarios both with and without the impact of the extra kWh from the EV.
As seen in this graphic, total savings since installation now stand at just over $5,000. Based on a capital cost of $18,000, this means that the system has paid back 28% of the initial investment and is on track for a simple payback period of 14.3 years.
This assigns no opportunity cost to the funds invested in the system, although it’s worth remembering that $10,000 of the cost was funded through an interest free loan from the Queensland government.
It is acknowledged that the analysis above blends the benefits of the solar and the battery together – this reflects the fact that, in our case, the two were installed as – and have always been seen as – a package deal. The benefit of adding a battery to an existing solar system remains marginal until drastic capital cost reductions occur.
After four years in operation, the home solar and battery system has provided a mountain of data and interesting insights.
A key takeaway for me (and perhaps the wider industry) is just how challenging it is for the average household to self-consume all solar PV generation even with a battery + EV + a concerted effort to do so.
This probably isn’t what readers who work for a DNSP or retailer were hoping to hear!
The flip side of this is just how challenging it is to fuel an EV from solar alone across all seasons. Perhaps a three-phase PV system as well as more battery storage would get you close – but you would risk entering the realms of the ridiculous for the average household to try to do so.
It’s fair to say that the economic case for an investment in a home BESS still doesn’t add up for most people. For most PV owners, a timer on the hot water system is likely to get much of the same load shifting benefit for only a couple of hundred dollars of investment.
But start to consider the intangible but substantial benefits of the backup feature, as well as being able to more confidently unlock ToU tariff structures for EV charging, and the value proposition gets maybe just a little bit more compelling for those beyond early adopting nerds (🙋)…
——-
Andrew Wilson is the Future Energy Development Lead at CS Energy. He and his team are responsible for helping deliver the transition of CS Energy’s portfolio through the development of new publicly owned renewable and firming assets.
The views expressed in this article are his own.
This post was published on August 23, 2023 10:15 am
Australia’s only solar panel manufacturer says its retail network has more than doubled over the…
Solar for Apartments Program offers up to $100,000 to eligible bodies corporate, 50% as a…
State government-backed rebate designed to install bulk residential rooftop PV and electric hot water has…
People who live in apartments are less likely to benefit from solar power or efficient…
Australia falls out of global top 10 solar countries. Plus: GridBeyond's Michael Phelan on the…
New Zealand company unveils plans to start making its new-look lead acid home batteries in…