It’s now been just over two years since our home solar and battery system was commissioned, so I was keen to dive into the data and see how it has performed.
This article will primarily focus on how the system performed in Year 2. A detailed analysis of performance in Year 1, along with more information and background about the system itself, is available here.
Key figures
Self-sufficiency for Year 2 came in at 89.8%. This was 2.4% lower than what was achieved in Year 1, driven by a range of factors discussed further in the next section.
Other key figures for Year 2 (and how they compare to Year 1) are as follows:
– Battery utilisation = 52.1% (up from 46.0%)
– Battery round-trip efficiency = 88.7% (up from 85.7%)
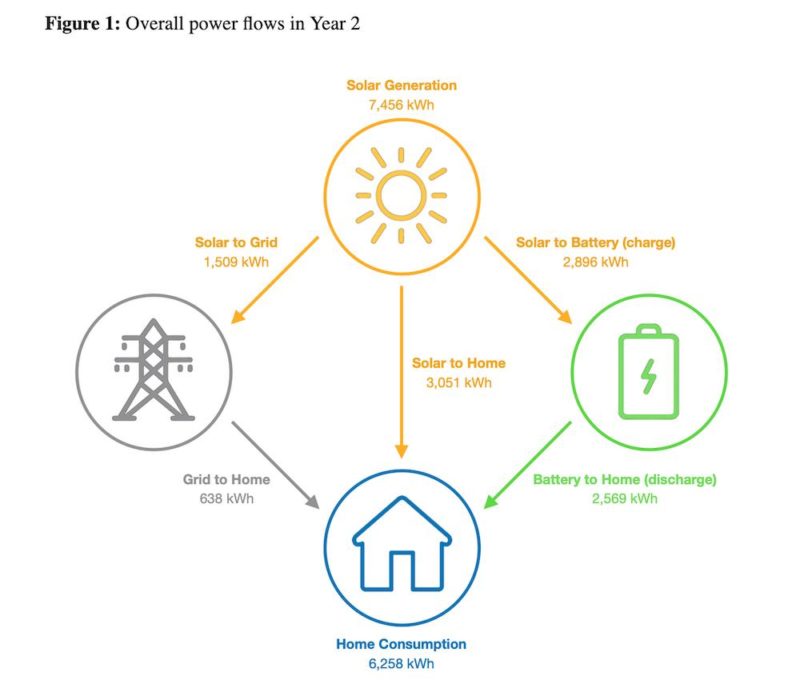
– Household consumption = 6,258 kWh (up from 5,095 kWh)
– Solar generation = 7,456 kWh (down from 7,825 kWh)
– Grid import = 638 kWh (up from 397 kWh)
– Grid export = 1,509 (down from 2,747 kWh)
Insights from Year 2 data
The biggest initial surprise from the Year 2 data was the large jump in household consumption – up 23% from the previous year. This can largely be put down to increased working from home over summer, combined with the much-needed addition of air conditioning to the home office.
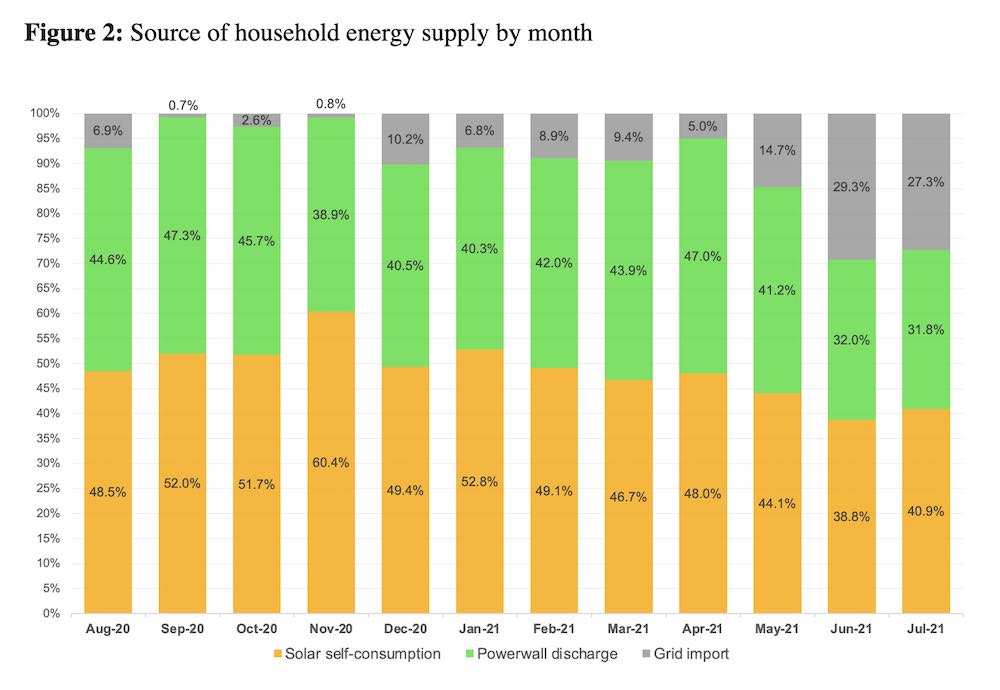
This increase in consumption had a noticeable impact on self-sufficiency, with an average of 92.8% between November to March in Year 2, compared to 98.8% in Year 1. Indeed, lower self-sufficiency across these summer months was solely responsible for dragging down the annual result, with remaining months roughly matching Year 1’s figures. A summary of household energy supply by month is shown below.
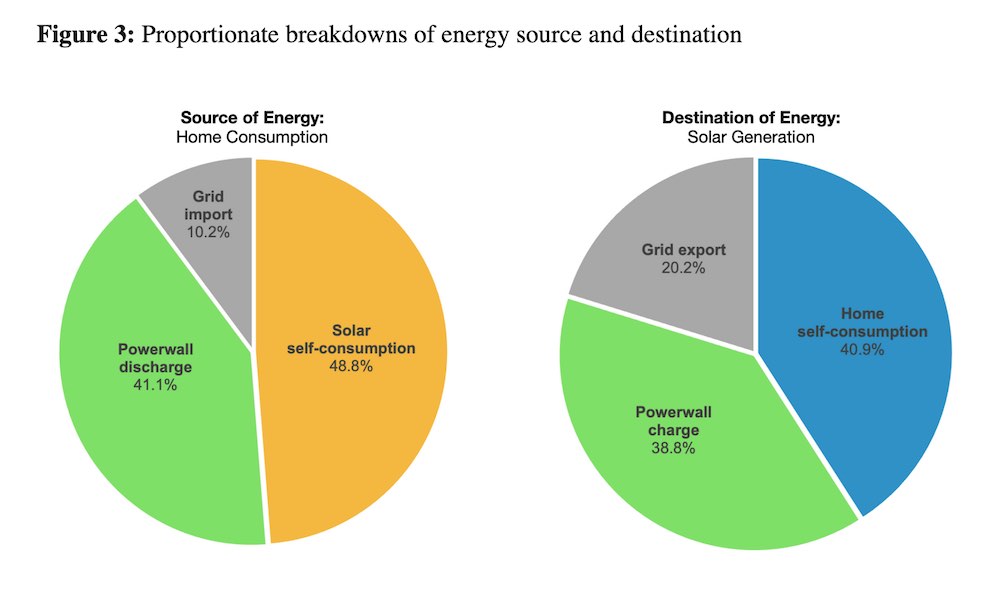
Increased household consumption also had a big impact on the role solar played in the energy mix. In Year 2 almost 80% of solar generation was either directly consumed or used to charge the battery. This is a big jump from Year 1, where only 65% of solar generation was used in this way.
This had the flow on effect of materially reducing the amount of solar generation exported to the grid, which was nearly halved between Year 1 and Year 2. Notably, overall solar generation was also down by just under 5%. Without any detailed analysis my gut feel is that this is due to what felt like a wetter year, although some minor impact from degradation would also be expected.
Considering the sharp downwards trend in feed-in tariffs, increased solar self-consumption and reduced grid exports could be seen as a positive outcome. It was also positive to see that battery utilisation (measured as average daily discharge as % of nameplate capacity) went up by more than 6% year-on-year.
This trend may present a problem, however, as our household looks to add an electric vehicle (EV) by the end of the year, with a desire to do most of the charging using surplus solar at home.
Implications for an future EV
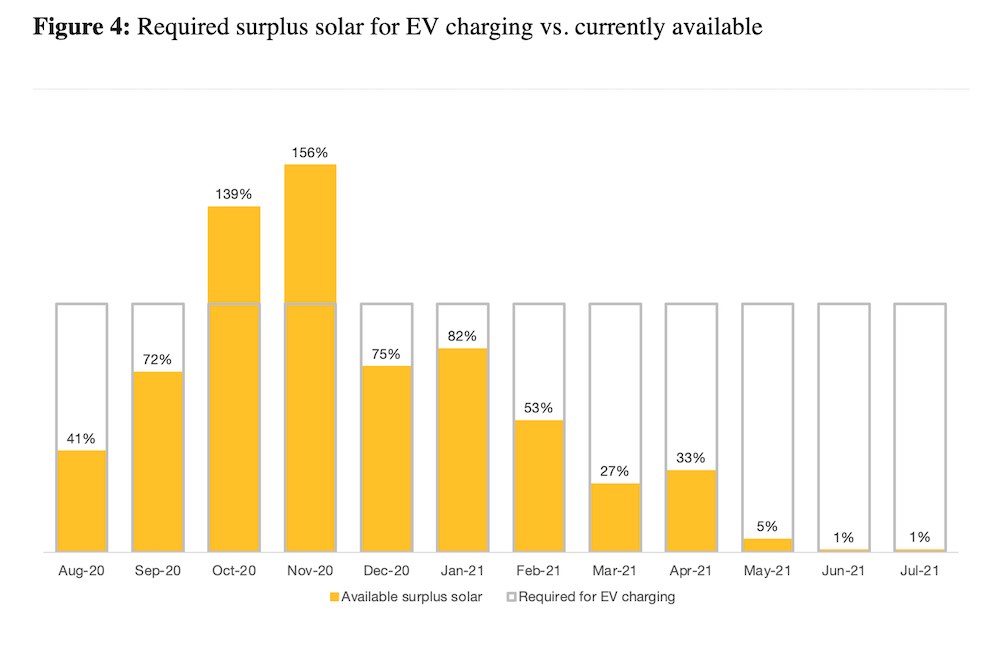
The data for Year 2 has been used to look at just how much ‘fuel’ may be available for a future EV – finding some worrying results. For the purposes of this analysis a few key assumptions and simplifications have been made – 15,000km of driving per annum (split evenly each month), 150Wh per km of EV consumption, and 15% energy loss via AC charging.
This finds that we would need an average of 221kWh of surplus solar each month to fuel the EV, compared to an average of 125kWh a month currently available – less than 60% of what we need. The situation gets worse when looking at this equation on a monthly basis (as illustrated in Figure 4 below) with large surpluses in October and November, and effectively nothing during June and July.
The outcomes of this analysis were a surprise, and have highlighted the need to try and address this before the EV arrives. Options being considered include increasing the DC capacity of the solar system up to the inverter OEM limit, or upgrading to three-phase power to enable a larger PV system.
These each have a number of technical and cost considerations to think about – watch this space for a future article! Even with a larger PV system, this has highlighted the fact that some degree of ‘from the grid’ home EV charging is likely to be needed.
It’s now on my to-do list to look into the best offerings currently available from electricity retailers for this, which will also hopefully incentive the use of surplus solar (just from our neighbours instead of us).
Technical & Backup Performance
Round-trip efficiency was markedly improved in Year 2 (88.7%) compared to Year 1 (85.7%), which came as somewhat of a surprise considering that landscaping changes meant the battery now gets more direct morning sun than before. This figure is still below the stated value of 90% from Tesla, although it is worth noting the calculation methodology is as simple as energy out divided by energy in and is hardly being measured under standard test conditions.
Year 2 saw the battery get its first real test of the backup functionality on May 25, 2021, where the incident at the Callide C power station sent almost 500,000 customers across Queensland into the dark. At our house the blackout lasted for 57 minutes, with the Powerwall performing flawlessly during this time – indeed, you wouldn’t have been able to tell there was a blackout at all except for the notification sent to my phone.
My view remains that this backup functionality is one of the killer selling points of home batteries that may help them bridge the ‘payback gap’ they currently face. In the face of increased wild weather combined with increased rates of working from home, more and more households may start to value the reliability of supply they can offer.
Interestingly, our neighbours also have a home battery system and were disappointed to learn firsthand the difference between whole-of-house backup vs. essential circuits only. This is a key selling point of the Powerwall 2 product, and is something that any serious battery OEM needs to be incorporating into their offering.
Financial Performance
Interest in the economics of home batteries remains strong and growing in the conversations I have had over the past year. Spoiler alert – the performance of our system over the past year didn’t deliver any revelations about the pure financial case for home storage, nor did there appear to be much in the way of changes to upfront costs, despite prices at the utility scale continuing to sharpen. Indeed, Tesla increased the price of the Powerwall 2 in many markets, primarily in response to strong demand following major grid outages in the US coupled with supply chain constraints.
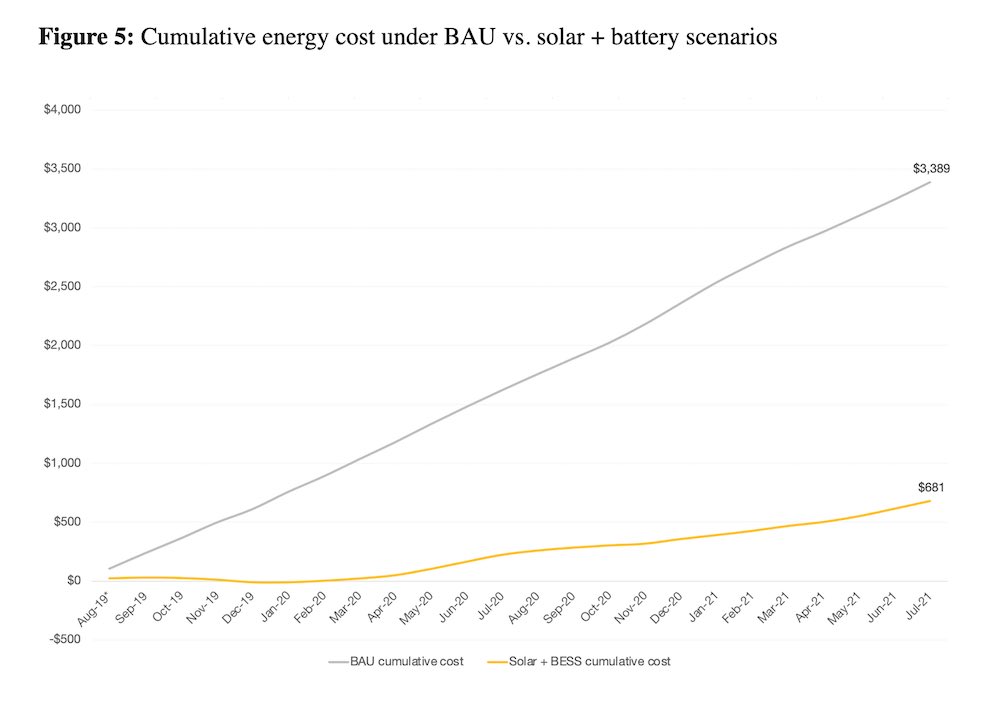
Using actual data and retail rates, it is possible to look at our household energy cost under a business-as-usual (BAU) scenario (no solar or battery) compared to what the net cost was with solar + battery. To assess this in context, a cumulative cost can be calculated for each month and compared, as shown in Figure 5. This finds that savings to date under the solar + battery scenario are around $2,700. Extrapolating (which I don’t advocate doing in isolation – see below) gives a 13 year payback for a solar + battery system with a cost of $18,000.
It is acknowledged the analysis above blends the benefits of the solar and the battery together – this reflects the fact we invested in the two as a package deal. The marginal benefit of adding a battery to an existing solar system remains limited. For that to change, upfront prices will need to drop and the ‘spread’ between the value of grid imports and exports will need to grow sharply.
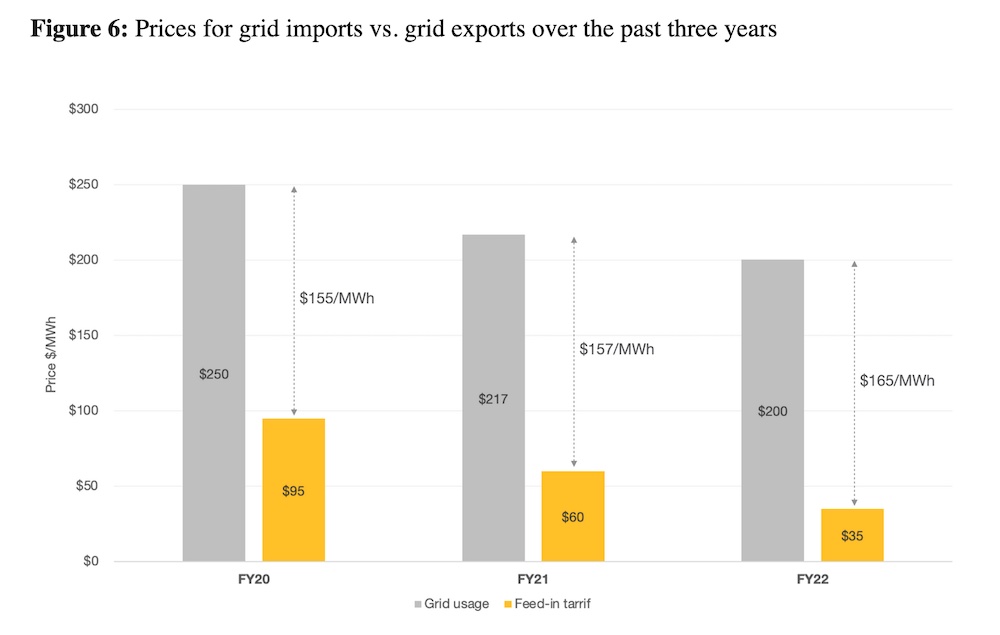
There has been some movement on the latter already, as seen in Figure 6, which shows the feed-in tariff and anytime consumption tariff from my retailer (Powershop) over the past three years. While overall energy prices have come down, the feed-in tariff has dropped by almost two-thirds over this time, increasing the spread a battery is able to benefit from to $165/MWh in the current financial year.
With feed-in tariffs likely to approach close to zero in coming years, this will likely start to have an impact on the thinking of solar households, for many of whom grid exports make up a sizeable component of the financial equation for their PV system.
In our case, despite deliberate efforts to maximise solar self-consumption, almost 60% of all solar generation would have been exported to the grid in the past year without the battery. This would have been worth $420 in FY20, but is today worth barely $150 and falling.
Summing Up
After two full years in operation, the investment in our home solar + battery system remains one that we are happy with. The cold hard financials still don’t add up for most people, but the satisfaction of maximising self-sufficiency remains.
The intangible but substantial value of the backup feature has also started to come into its own and will likely continue to do so in coming years. With an EV soon to be added to the mix, alongside the impact of rapidly falling feed-in tariffs, stay tuned for the Year 3 report card!
Andrew Wilson is a Director in KPMG’s Energy Infrastructure team. He has deep expertise in renewable energy projects and energy markets and brings experience across all stages of the energy infrastructure lifecycle, from feasibility and development through to construction and operations. Andrew is passionate about leading change and solving the complex challenges of the energy transition.
The views expressed in this article are his own and do not necessarily represent those of KPMG.
This article was originally published on LinkedIn. Reproduced here with permission.
