RenewEconomy
Since Tesla dropped the Powerwall, numerous claims have been made about what this means for households and the grid, ranging from ‘The Powerwall changes everything’ to why it’s ‘just another toy for Rich Greenies’.
In order to guide the economic discussion, I’ve created a simple calculator which allows people to investigate for themselves the household economic impact of solar plus batteries at Tesla prices!
To access calculator, click on this link. It will download to your laptop or computer. You will need Excel. Simple Solar plus battery economic calculator.
It’s free to download, use, and adapt for non-commercial purposes. Ensure you read the model limitations and assumptions before you begin, and interpret results accordingly.
Example – A working household in Sydney
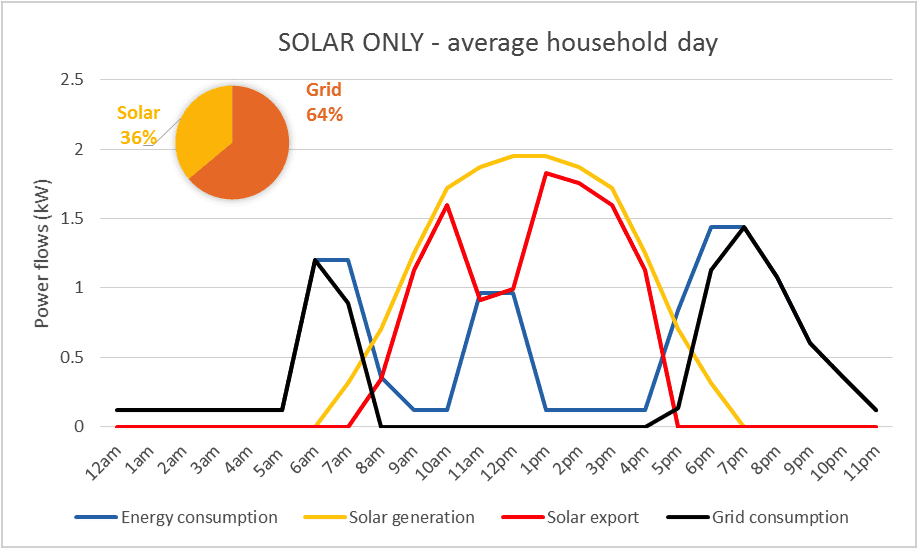
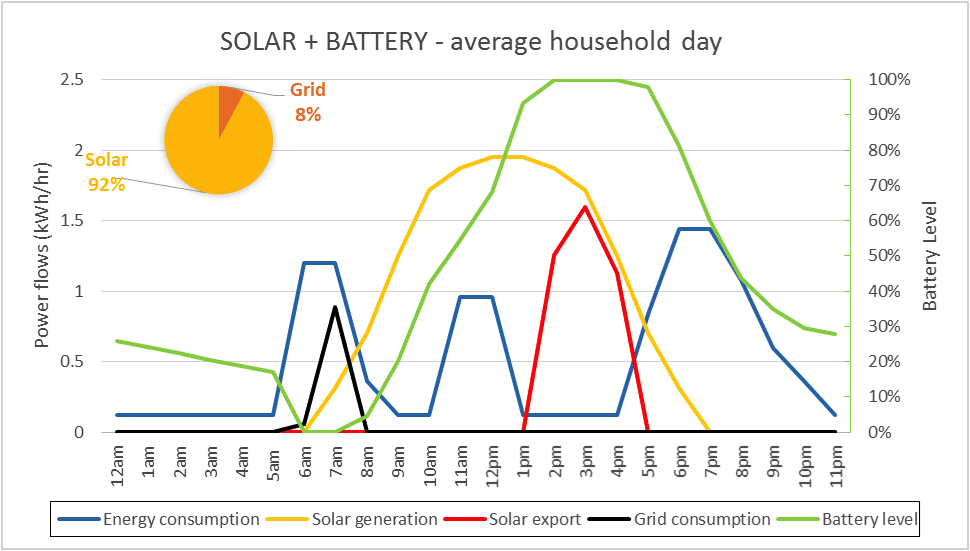
Here is a sample output for a household in Sydney with 12kWh daily consumption, who install a 4kW solar system with 7kWh Powerwall. They have a typical ‘working household’ load profile with some controlled daytime loads such as washing machine and dishwasher. The energy flows in the charts below are based on an average day – that is with average solar output and average electricity consumption.


Summary
The most notable impact is that the entire evening peak demand is covered by the battery. With solar and battery combination, the households source 92% of their energy from solar, versus just 36% with solar only. The day’s grid cost for this household is just 4c (excluding fixed costs) with solar and battery installed.
With the 7kWh battery pack installed, the householder pays the equivalent of 30c/kWh (levelised cost) for their solar and power, which for many households is at grid parity.
At current prices obtained from Solar City ($US7160 for the 10kWh fully installed), if it were a straight numbers race, the optimal decision for this household, if their flat electricity tariffs is 30c/kWh, is to:
1st – install Solar (16% decrease in annualised net energy cost compared to grid only),
Tied 2nd – Install Solar and battery (0% change in annualised net energy cost)
Tied 2nd – Use Grid power only
What does this mean?
For many households, like the worked example above, installing ‘solar only’ is still the most economic option for household energy supply. At Tesla’s current pricing, ‘solar and battery’ is neck-and-neck with the grid in Australia. But it’s not a hard and fast rule – it depends on the discount rate, real-world variations in the household’s energy use and solar generation, plus a number of unknowns: such as the cost and terms of Tesla’s extended warranty, the efficiency degradation, and the maximum daily depth of discharge.
This simple analysis indicates that the Powerwall will not yet spur mass market uptake, but it is tantalisingly priced for attracting a raft of early adopters, particularly when factoring in the value of reduced grid dependence. If future electricity prices rise and Tesla’s prices reduce, the economic equation could clearly shift in favour of solar and batteries.
Note: this calculator is intentionally kept simple – please read the model limitations within the calculator for more detail before interpreting results. For precise economic analysis, the ATA is releasing an updated battery inclusive version of the ‘Sunulator’ later this year, which will conducts annual simulations for variation in sunshine and household demand.
What does Tesla’s PowerWall do to your daily energy flows? Download the calculator to find out!
Simple Solar plus battery economic calculator
Chris Cooper is an energy analyst and President of Repower Shoalhaven, a community energy organisation who create renewable energy project for everyday people to invest in.
This article was first published at RenewEconomy.
